Subscription-based cloud solution for your reports
We bring you a flat rate subscription offer, outsourced with secure access to your dedicated server, hosted in one of Microsoft Azure or partner data centers. A global offer that allows you to avoid the hassle of deploying and maintaining the necessary infrastructure and guarantees the availability provided by Microsoft data centers

 We provide integrated architecture offerings in our Azure tenant. We can also
offer you the solution deploymnet in your own tenant, this service including the complete implementation followed by training / validation estimated
between two and three days of Monitorpack engineer with required skills for Azure Entra.
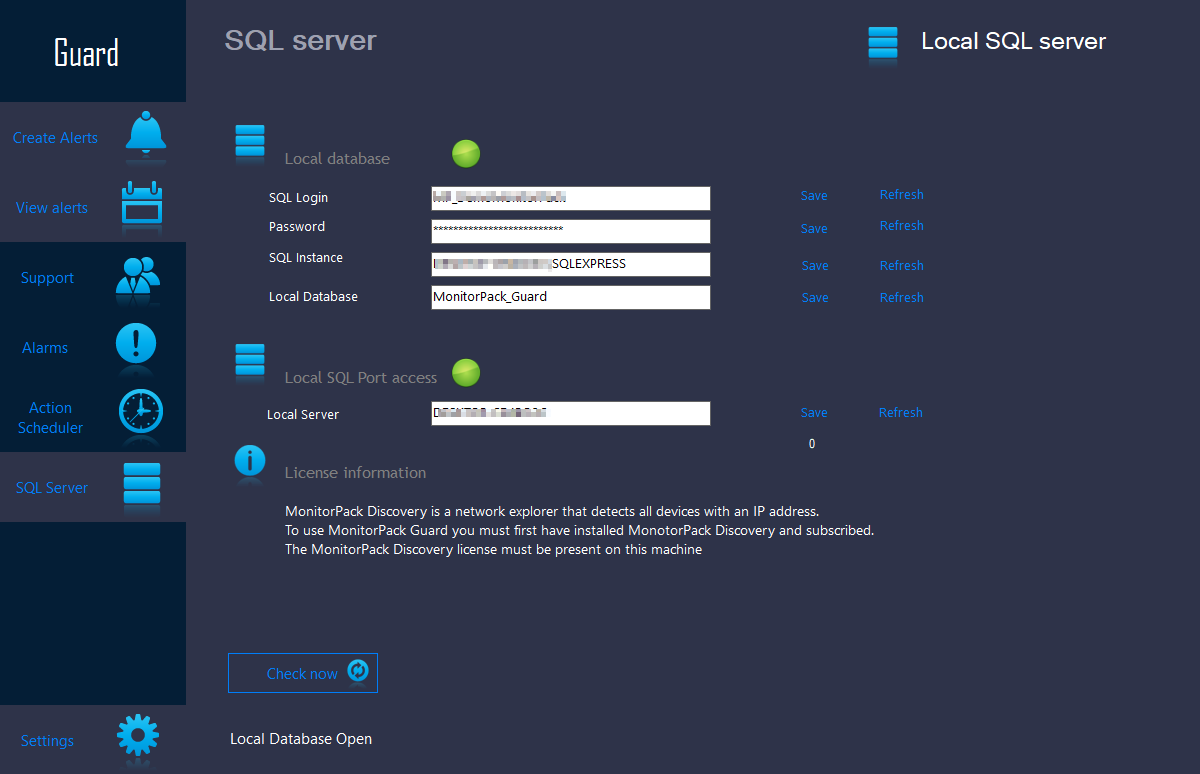
SQL integration for your reports
Monitorpack allows you to create your own SQL reporting environment locally. To do this when subscribing to Monitorpack.
You can deploy your SQL server wherever you want on-premise, in the cloud, in Azure, from a provider as long as the configuration of the SQL instances
is correctly configured.
- Aggregate data & consult report on your own site,
- Aggregate data & consult report on AWS, in your tenant or you regular Data Center provider,
- Aggregate data & consult report with Power BI client.
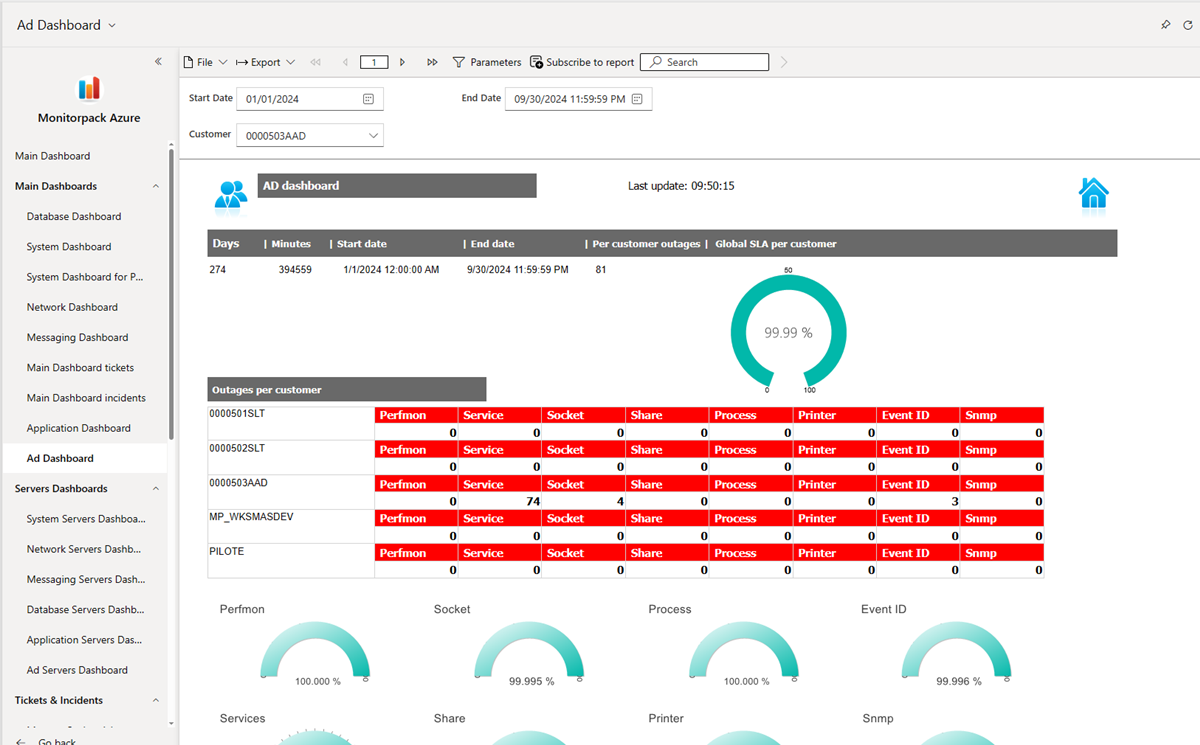
Power BI Dashboards with vital information
1. Global health - When a production stoppage occurred less than 5 minutes ago, the health level turns red for the concerned dashboard.
2. History of production stoppage in the time window - Number of alarms which were effective in the time window of this dashboard and which result
in a degradation of the SLA.
3. Total alarms per dashboard.
4. History of incidents or alarms - Classification of incidents by total severity level of incidents, closed incidents and open incidents.
5. Statistics - Dashboard of alarm statistics per day by alarm or by production stop or by type.
Network Response Time Analysis
1. Response Time - Response time is expressed in milliseconds and can measure any well-formed URL.
2. Status - Depending on the complexity of your alert you can combine status and response times to trigger
your alarm. Statuses can be unknown, time or, malformed address, invalid port or invalid address, you choose
the status that will trigger the alarm.
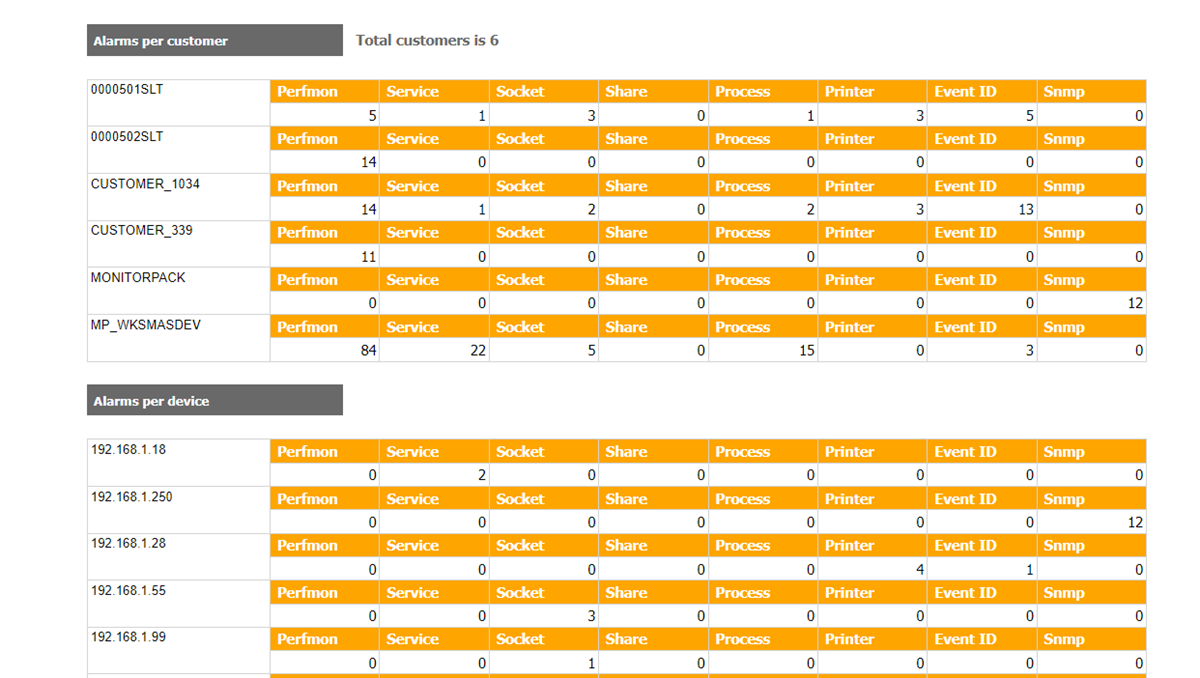
All your sites, agencies or clients on a global view
1. Alarms by customer or site - Alarms are filtered by customer and alarm type
2. Alarms by device - alarms are filtered by device and alarm type
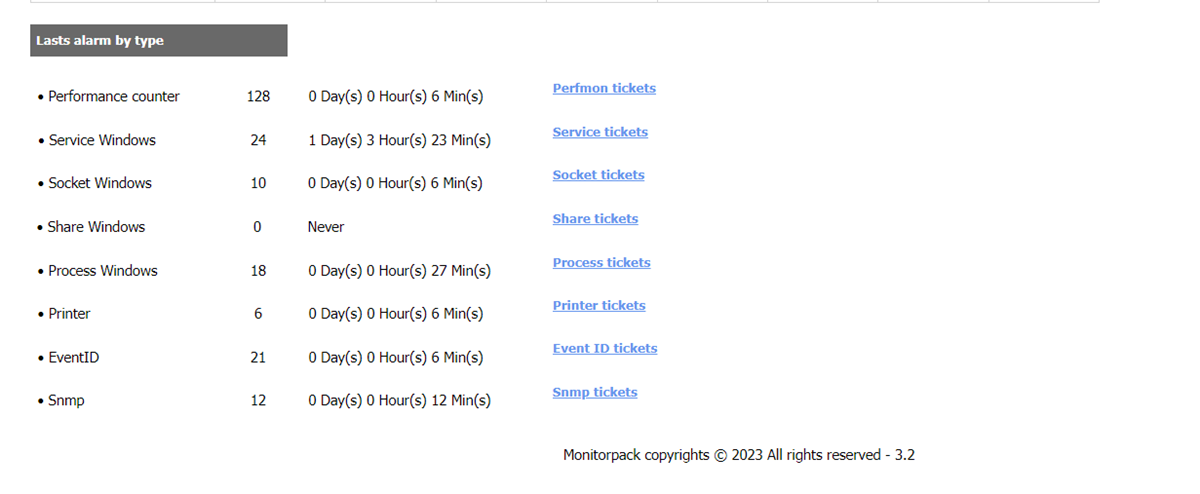
1. Latest alarms - My alarms are sorted with the last alarm which was recorded, access to detail is done by table
on-board for each alarm type.
Availability of your applications and infrastructures
1. SLA per application or service - Detailed calculation of the availability rate per application, whether messaging, active directory databases, etc.
Incidents by customers
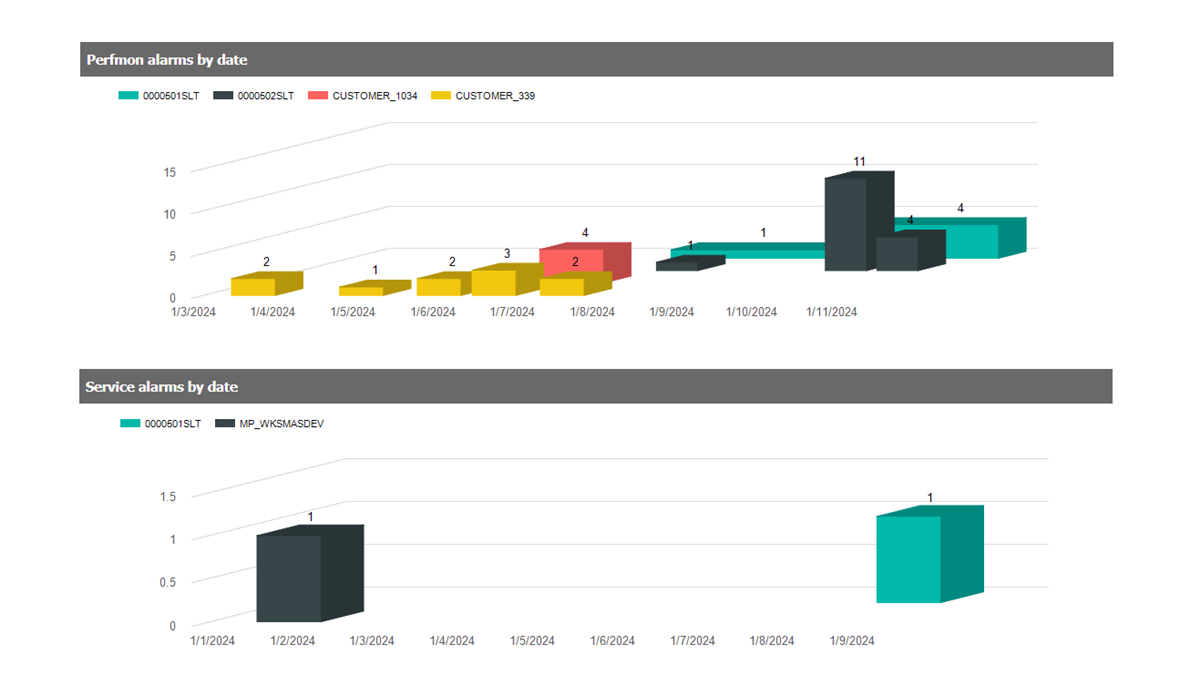
1. Details of the number of alarms by type and by customer.
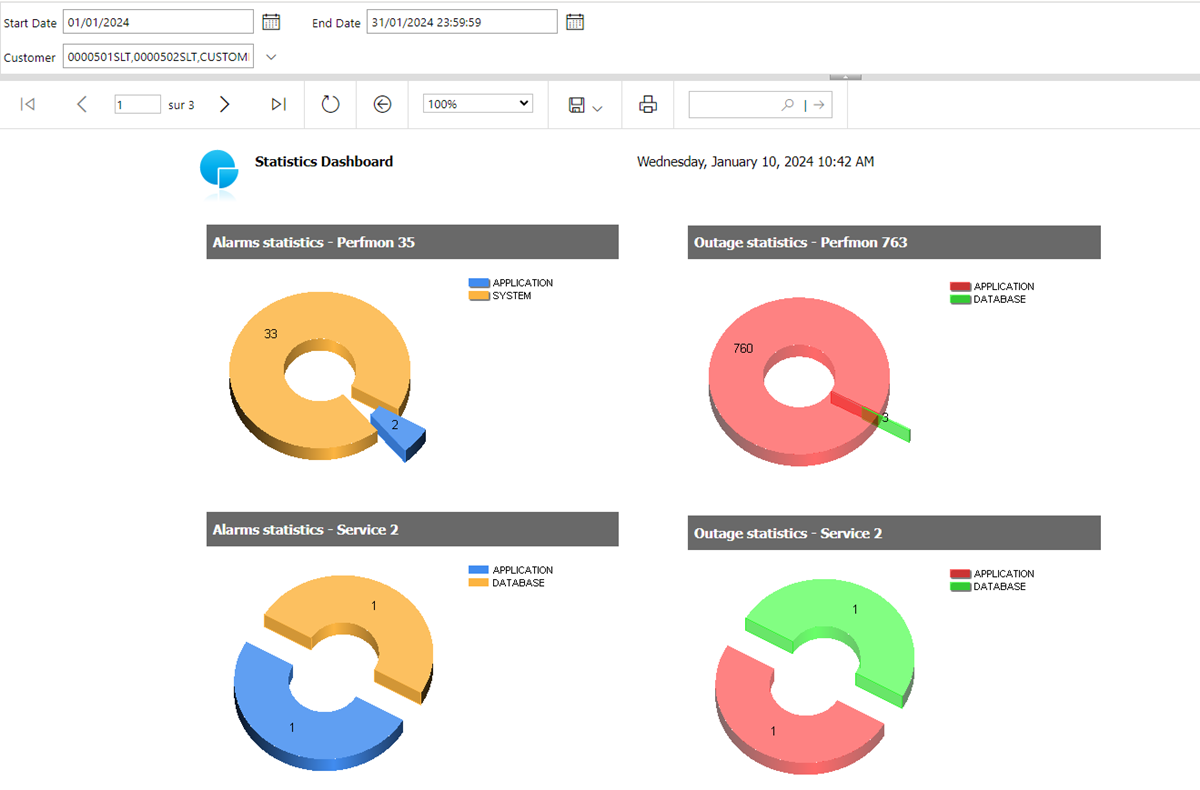
Overall statistics
1. Alarms by type by dashboard (Application, Database, etc.)
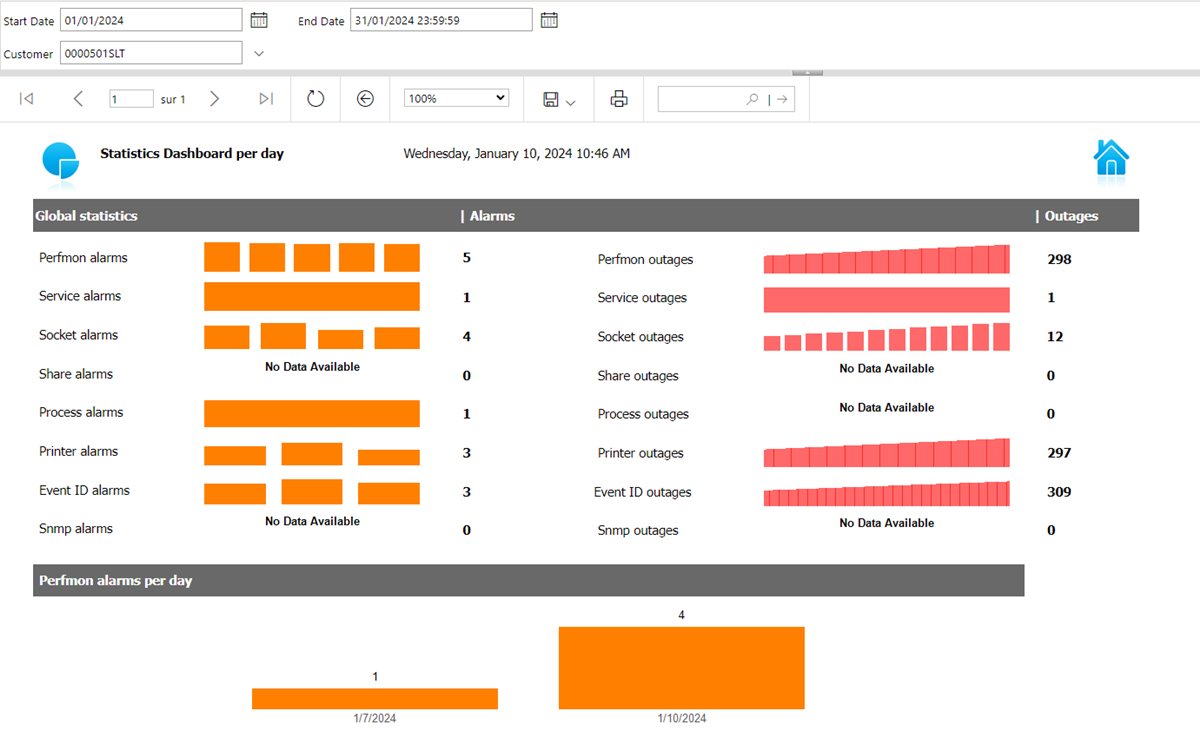
Daily statistics
1. Alarms by type by type & by customer/site

